Spectrum is for telecommunication what jet fuel is for aviation. Spectrum is a range of electromagnetic frequencies or airwaves that telecom companies use for establishing a connection between a cell tower and a mobile phone. The bandwidth of this spectrum is directly proportional to the speed of a wireless data network (since more data can be transmitted simultaneously through a broader data pipeline). In contrast, the frequency is inversely proportional to the coverage (since lower frequencies penetrate better through physical barriers and thus have wider coverage).
The spectrum holding data sheet embedded in this article represents the current spectrum holdings of all active telecom operators across all frequency bands across all 22 telecom circles along with their liberalisation status and expiry dates. All figures represented are in MHz. The value mentioned in the bracket beside the frequency at the base of each sheet is the band number where ‘B’ stands for 4G LTE band whereas ‘n’ stands for the corresponding 5G NR band.
The spectrum shown under BSNL and Aircel in white is reserved for the respective operators but has not yet been officially allotted to them.
Spectrum Liberalisation:
Spectrum was administratively allocated to operators in each of the 22 licensed service areas or circles prior to 2010, this spectrum is called non-liberalised and can only be used for 2G services whereas all airwaves allotted post-2010 have been through a Spectrum Auction where operators have paid the market discovered price and this spectrum is called liberalised and can be used for any technology platform 2G/3G/4G/5G. Alternatively, operators may choose to liberalise their administratively allotted spectrum by paying the market-discovered price to DoT on a pro-rata basis for the remaining validity of the spectrum.
Paired and Unpaired spectrum:
Spectrum may be paired or unpaired, bands 1/3/5/8/28 are all paired where one set of frequencies is used for uplink whereas another distinct set of frequencies is used for downlink known as Frequency-division duplexing (FDD), whereas bands 40/41/78/258 are unpaired where both uplink and downlink happens in the same set of frequencies separated by the time of uplink and downlink known as Time-division duplexing (TDD).
List of Indian FDD Bands:
| 4G LTE band | 5G NR band | Uplink frequency range (MHz) | Downlink frequency range (MHz) | Bandwidth for telecom (MHz) | Block size (MHz) |
|---|---|---|---|---|---|
| B1 | n1 | 1939-1979 | 2129-2169 | 40×2 | 5×2 |
| B3 | n3 | 1710-1780 | 1805-1875 | 70×2 | 0.2×2 |
| B5 | n5 | 824-844 | 869-889 | 20×2 | 1.25×2 |
| B8 | n8 | 890-915 | 935-960 | 25×2 | 0.2×2 |
| B28 | n28 | 723-733/ 738-748 | 778-788/ 793-803 | 20×2 | 5×2 |
List of Indian TDD Bands:
| 4G LTE band | 5G NR band | Frequency range (MHz) | Bandwidth for telecom (MHz) | Block size (MHz) |
|---|---|---|---|---|
| B40 | n40 | 2300-2380 | 80 | 10 |
| B41 | n41 | 2535-2555/ 2615-2655 | 60 | 10 |
| – | n78 | 3300-3670 | 370 | 10 |
| – | n258 | 24250-27500 | 3250 | 50 |
Spectrum caps:
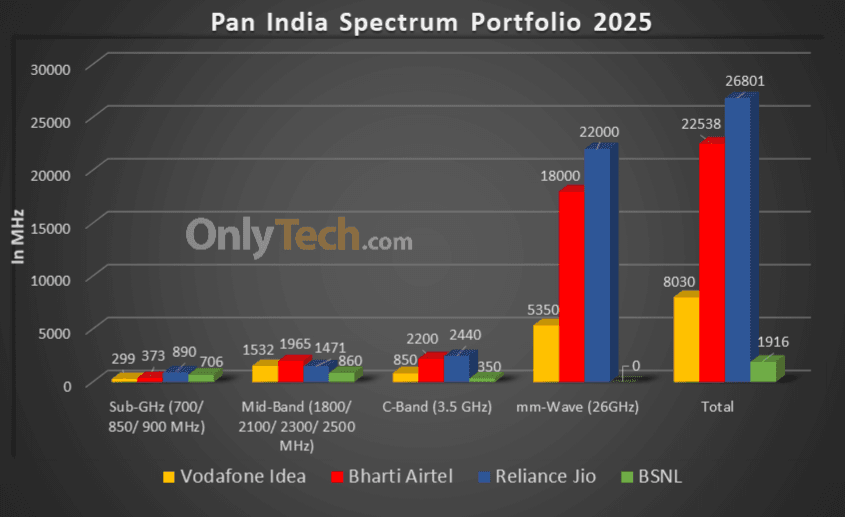
A spectrum cap dictates how much spectrum a particular operator can hold in a circle for a specific band. There is a 40% cap for Sub-GHz spectrum in the 700/850/900 MHz bands combined, a 40% cap for Mid-Band spectrum in the 1800/2100/2300/2500 MHz bands combined, a 40% cap for the C-Band spectrum of 3300-3670 MHz and a 40% cap for the mm-Wave spectrum bands of 24.25-27.5 GHz. The current spectrum caps are denoted in the spectrum chart.
Overall spectrum holdings of operators (in MHz):
| Operator/Holding | Jio | Airtel | Vi | BSNL |
|---|---|---|---|---|
| Sub-GHz | 890 | 373.2 | 298.8 | 706 |
| Mid Band | 1470.8 | 1964.9 | 1531.6 | 860 |
| C-Band | 2440 | 2200 | 850 | 350 |
| mm-Wave Band | 22000 | 18000 | 5350 | 0 |
| Total | 26,800.8 | 22,538.1 | 8,030.4 | 1,916 |
Spectrum sharing/trading/leasing guidelines:
- Telecom operators holding CMTS/UASL/UL licenses can enter into a Spectrum-Sharing agreement with each other so long as both parties hold liberalised spectrum in the same band in the same circle. Spectrum sharing is possible only on a Pan LSA level in block sizes defined by DoT and only after one year of an operator acquiring the spectrum.
- Telecom operators holding CMTS/UASL/UL licenses can enter into a Spectrum-Trading agreement with each other so long as the spectrum being sold is liberalised. Trading of spectrum is possible only on a Pan LSA level in block sizes defined by DoT and only after two years of an operator acquiring the spectrum.
- Telecom operators may enter into a Spectrum-Leasing agreement only with Enterprises holding a Captive Non-Public Network (CNPN) license and not with each other. The lease may be limited to any geographic area within the LSA and for any duration mutually agreed upon by both parties. A CNPN licensee can lease spectrum from multiple operators within an LSA.
Note: We update this chart in real-time to ensure it is always up to date with the latest changes in spectrum holding. Certain human errors might have crept in during the manual compilation of the data, any mistakes/ rectification can be brought to the Team’s notice through the comments section below.


Great curation Esmail. I keep referring to this chart quite often.
I have a small suggestion regarding the colour coding w.r.t the expiry timelines. Why don’t you consider adapting a different scheme where non-liberalised is coloured in reds say light pink to red, the darker shade expiring soon and lighter shade expiring a little late. Similarly for liberalised ones, light green to dark green where dark green expiring very late.
That way we can have a red to green transition. Always looking at the legend seems confusing. This is just a suggestion as I understand the effort it takes to rework the whole thing again.
Hello Srivastava, thanks for the appreciation. Regarding the colour scheme I’ve tried to keep the colours as distinct as possible so that ppl with a weak colour perception can also use the chart easily. Since we have multiple years of expiry of both liberalised and non-liberalised spectrum, using shades of a single colour can cause confusion between the shades in the middle of the timeline though the extreme ends would be distinct. What I can still do is to try and keep a colour constant throughout the chart for that year. For example Yellow for spectrum expiring in 2021 in every band, though in 850 MHz it denotes liberalised and in 1800 MHz it denotes non-liberalised Spectrum. But if I can standardise that, then it will require lesser refering to the index.
Great repository of spectrum information Esmail. Thank you for sharing.
Is it possible to provide the actual spectral allocation range per operator in each circle, so you can see what operator is adjacent to another operator, etc. Many thanks!
Thanks for the appreciation, I understand your suggestion completely but I’m unable to accomodate the same since the spectral allocation ranges in public domain are only available for spectrum bought in Auction (liberalised) not for the one that was allotted administratively (non liberalised) pre 2010.
Also the actual spectral allocation slots keep changing as operators enter into spectrum trading and sharing agreement with each other and when an operator buys spectrum in an auction. DOT tries its best to ensure that all spectrum blocks held by an operator in a band are made contiguous so that it can be used as a larger block for high speed data services.
Which is why it is not possible to get the realtime information of these changing allocations unless DOT releases them in public domain.
Thanks for the detailed explanation. Keep up the great work.